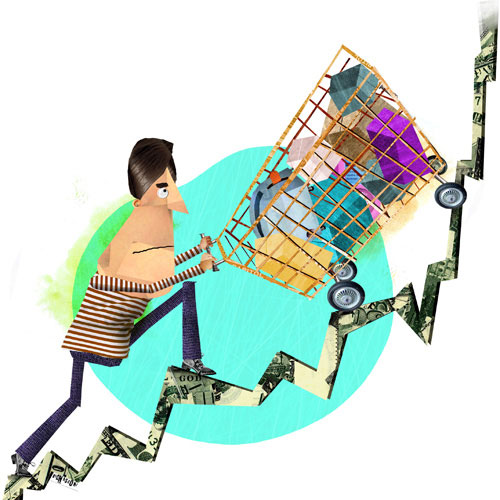
Is my job safe? Are prices rising or falling for gasoline and my prescription drugs? Is the value of my home increasing? Can I expect rates to go up or down on my home-equity line and bank CD?
These are the everyday money questions consumers ask. Answers come in the form of economic indicators—those seemingly daily reports describing the American economy and predicting how it will fare in the future.
Indicators include the unemployment rate, the consumer price index, and home sales. They even include the stock market reports and the constant handwringing about what the Federal Reserve System decides to do—or not do—with interest rates.
But there are so many indicators, and the media reports the latest ones as they’re released, making them all seem equally important when they’re not. In fact, indicators you hear reported regularly aren’t necessarily the best ones to pay attention to. Here are a few of the indicators you most commonly hear about
on the news, with suggestions on what’s worth following.
Consumer Price Index (CPI)
Measures: Inflation
Released by: U.S. Department of Labor, midmonth.
What could be more relevant than the CPI? It measures inflation—the rising prices or falling value of the dollar from the perspective of the average consumer paying for everyday goods and services. The CPI strives to represent price movements in a typical “market basket” of goods and services, from orange juice to airline tickets. But the CPI applies to all of us collectively, not individually. That’s because all households buy different stuff, of course.
If gasoline prices are down but prescription drug prices are up, that may be good for a young, healthy guy with a long work commute, but bad for his grandmother, who takes 11 prescriptions a day and only drives to church on Sundays. Her inflation rate is much higher than the CPI rate announced by the government.
Another problem is that food and energy prices are volatile and can skew a monthly reading of the CPI. So, economists talk about the “core” rate of inflation: the CPI minus food and energy prices. But that number is divorced from a consumer’s reality—has there been a recent month when you didn’t have to pay for food or energy?
A final drawback: After weeks of paying higher prices for gas at the pump or milk in the market, do you really need an indicator to come out a month later to tell you those prices rose?
But for all its problems, CPI is a decent indicator for the general direction of consumer prices. And you can get CPI estimates for various regions of the country and for individual spending categories at bls.gov/CPI.
What to watch: A more predictive indicator of inflation, however, is the monthly producer price index (PPI) that measures prices factories are paying to make stuff. For example, if producers are paying more now to make their goods, they will pass along those costs, and the consumer will pay more at retail. Find the current PPI at bls.gov/bls/newsrels.htm.
Unemployment Rate
Measures: Joblessness
Released by: U.S. Department of Labor on the first Friday of every month.
“This is the big Kahuna of economic data,” says R. Mark Rogers, a senior economist with economic-data firm Econoday and author of The Complete Idiot’s Guide to Economic Indicators. “The employment situation report is probably the most watched economic report in the world.”
And for consumers specifically, employment is far and away the most important indicator of economic well-being. An old economist joke is about how the average Joe defines recession: “My neighbor lost his job.” The definition of depression? “I lost mine.”
Granted, many Americans receive a majority—or all—of their income from a job. But the unemployment rate might not be the best indicator to follow. For one, it’s a lagging indicator, which means it tells you nothing about the current health of the economy or its future. Hiring and firing workers is a big deal. So employers are slow to lay off workers as recession approaches and slow to hire them back as the economy recovers. Hiring may not return for months or even years after a battered economy has healed.
There’s a lot baked into the single number called the unemployment rate. Instead of being a direct count of unemployed people, for instance, it uses a survey based on a sample of 60,000 households—“Hi, I’m from the government. You got a job or not?”
But being jobless isn’t enough. The unemployment rate doesn’t include a jobless person unless he or she is actively looking for work. During tough times, the unemployment rate would be much higher if it included hapless job hunters who temporarily gave up a job search because they’re discouraged.
What to watch: A better indicator is the monthly jobs report, also known as the nonfarm payroll employment. It, too, is based on a survey, although a more comprehensive one—of employers, not individuals. Look for whether the total number of jobs is going up or down. This is a closer reflection of the current job market. View the latest report at bls.gov/bls/newsrels.htm.
Perhaps better yet is a weekly employment indicator that looks ahead. It’s called initial unemployment insurance claims, often reported as “first-time jobless claims.” This is an actual count—not based on a survey or otherwise contrived—of everybody who for the first time applied for an unemployment check that week. Loosely, it’s a measure of people who had a job last week but don’t now. See dol.gov/opa/media/press/eta/ui/current.htm.
Existing Home Sales
Measures: Sales activity in the used-home market
Released by: National Association of Realtors around the 25th of the month.
Home sales and prices are always important indicators for consumers.
The value of your home is important for more than its potential sale value.
It could affect whether you can stop paying private mortgage insurance and how much you can borrow using a home-equity loan or line of credit.
Problem is, like weather, all real estate is local. It would be silly to say, “It’s partly cloudy with a chance of showers in the United States today.”
Just so, a national home-sales number might not say much about the value of your house or sales activity in your neighborhood. Fortunately, at realtor.org, you can get house prices for metropolitan regions.
What to watch: Keep an eye on monthly housing starts. Officially called new residential construction, it’s released midmonth jointly by the U.S. Census Bureau and the U.S. Department of Housing and Urban Development. Housing starts is a count of residences newly under construction. The idea is that demand is strong if builders are putting up new homes. When demand is high, prices rise for both existing and new homes.
“If you want to know where the economy is going, housing starts is much better than home sales. It’s a good leading indicator about what’s going on,” said John Silvia, chief economist for Wells Fargo.
Slightly more ahead of the curve is monthly building permits, also tracked by the U.S. Census Bureau. Permits are issued when a builder first gets permission from a municipality to start digging foundations.
Other good price data—and some would argue superior data—on housing come from the Case-Shiller Home Price Index and the Federal Housing Finance Agency’s House Price Index. Both measure prices differently than the Realtors group and offer prices in local regions. For the newest releases, visit macromarkets.com/csi_housing/sp_caseshiller.asp (index from S&P/Case-Shiller) and fhfa.gov (index from the Federal Housing Finance Agency).
Following the Fed, the Market, and More
Other economic indicators may not always have an alternative option, and they’re not always easy to interpret either, but they’re worth understanding:
Federal Reserve Bank Interest Rate Decisions: The Federal Open Market Committee (FOMC) controls short-term interest rates by setting obscure banking rates, which they do eight times per year. But changes in those rates affect consumer saving and borrowing. For example, Fed moves can influence interest rates on credit cards, bank CDs, and auto loans. However, those changes have little effect on longer-term rates, such as for 30-year home mortgages.
FOMC rate decisions are important, but in recent times, target rates have been essentially zero. So, short-term rates haven’t varied much.
The Stock Market: The market is one of the most forward-looking indicators, as traders try to guess how companies will perform. They buy shares based on whether they think the price will rise or fall. But whether you follow the Dow Jones industrial average, the S&P 500, or some other measure, there’s a whole lot of speculation and human emotion built into share prices. Indexes can fluctuate wildly day to day, which is why, as an economic indicator, it may be better to look only at longer-term stock market trends. Watching those indexes daily could drive you mad, so don’t bother unless you’re a professional broker—or a seriously committed amateur.
Gross Domestic Product (GDP): On the one hand, the GDP is very important because it’s an overall snapshot of the United States economy—it’s the total output of the nation, including consumer spending, business investment, government spending, and imports and exports.
The biggest problem with GDP is it comes out just quarterly, and the first number reported is often significantly revised later on, which might change its meaning. It’s like a newspaper that prints an article with an error and then later prints a correction in some obscure part of the paper where nobody sees it. Most people will go on believing that what they originally read was correct. Terry Connelly, dean of the Ageno School of Business at Golden Gate University in San Francisco, calls the first release of the GDP figure “the biggest fraud on the market” because it lacks so much hard data.
Your Personal Indicators: The most important economic indicators for you won’t appear in the newspaper or the evening news, but you could probably lay your hands on them right now. Look at your paycheck stub. Check your bank statements. When was your last pay raise? How much is your employer deducting for health insurance? Do you have a cash cushion in your savings account? And what’s the amount of debt you carry on your credit card? Ultimately, the big-picture number that matters most to individuals is their net worth, which is all you own minus all you owe. If you liquidated your life, sold all you have, and paid off all your debts, what’s the final dollar value on your name? Is your net worth rising or falling?
Your personal information gives you important data, but so do your own on-the-ground observations as you go about your day. Pay attention to crowds, which in many situations signals prosperity. How much traffic is on the highway? Do you have to wait to be seated at restaurants? Is the jewelry store bustling? What you see may not appear on any report, but it can give you valuable clues about economic health as it applies directly to you and your community.
Become a Saturday Evening Post member and enjoy unlimited access. Subscribe now


Comments
What a great article. Thank you for the wonderful job you are doing. I do agree with you 100% that ultimately, the big-picture number that matters most to individuals is their net worth. If the net worth is negative that means you owe more than what you own, which is not good, but on the other hand if it is positive and your net worth is improving each year you will be in a better position to retire and enjoy the fruits of your hard work. My hope is that more persons will be reading these articles so that they can be educated on the financial aspects of their lives.