The Story of the Presidency in 7 Charts

Which president issued the most executive orders? Who was the oldest at the beginning of his term? Which ones had mustaches? We tell the story of American presidents in these eight charts. Click on each one to see more detail.

 Click on each chart to enlarge it. Charts created by Brian Sanchez.
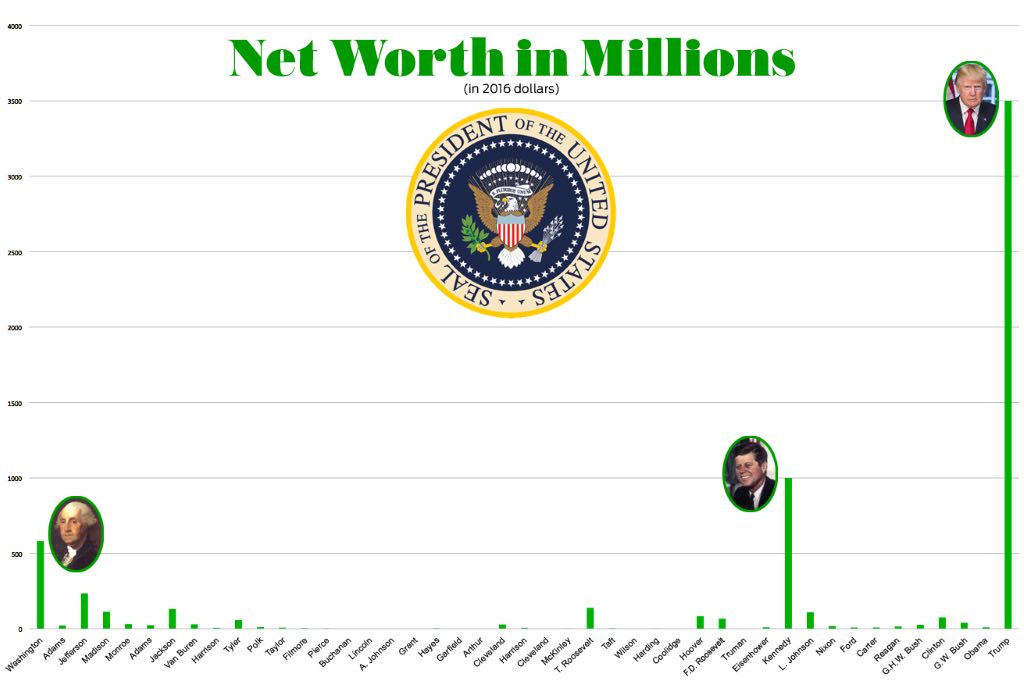
Chart demonstrating President Net Worth, in millions
Click to enlarge. Data source: Wikipedia


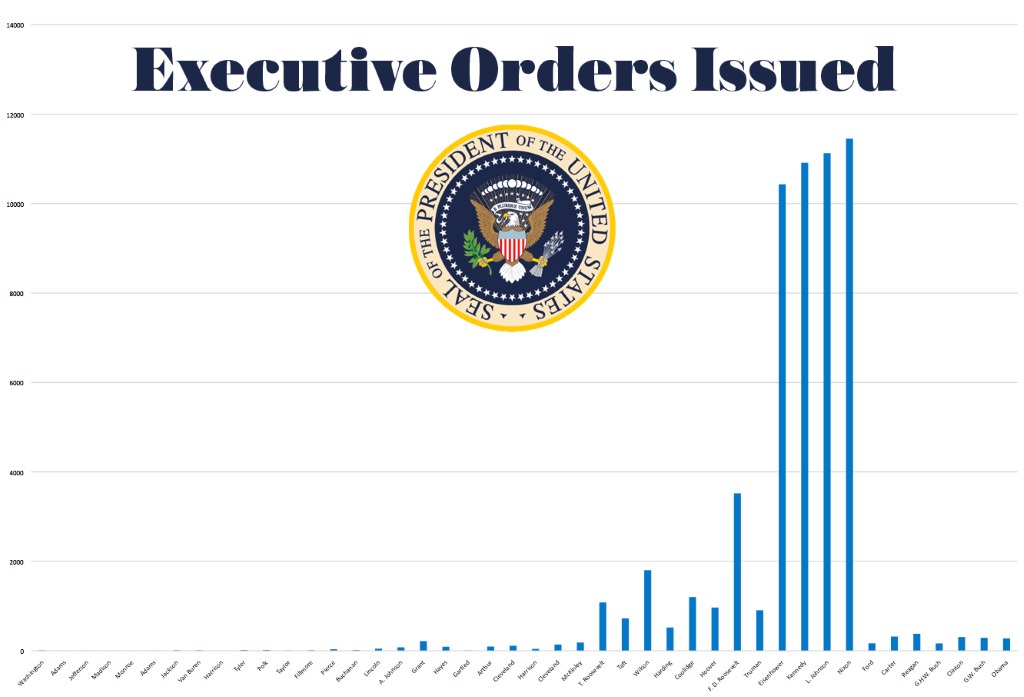
Chart demonstrating the number of executive orders Presidents signed while in office
Click to enlarge. Data source: Wikipedia


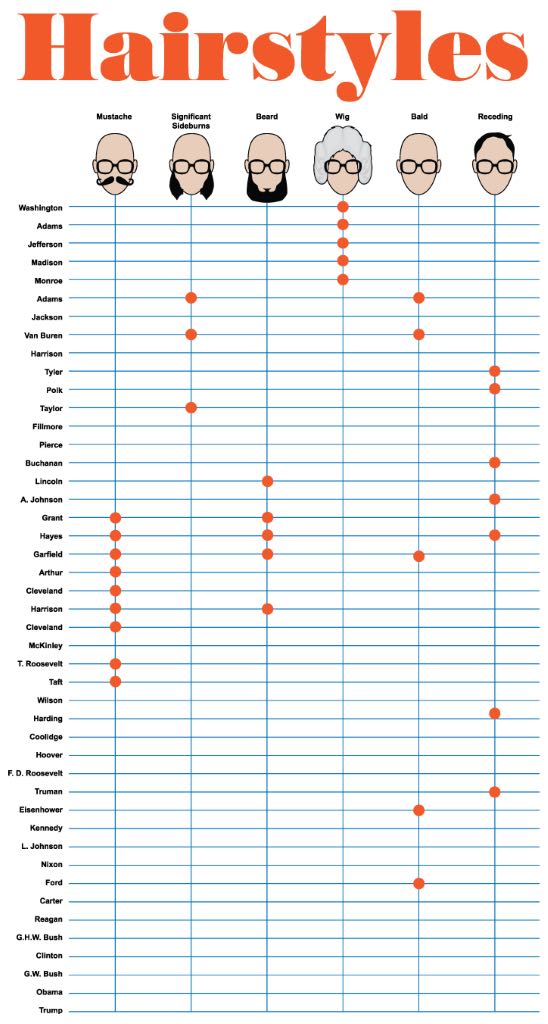
Chart showing presidential hairstyles
Click to enlarge


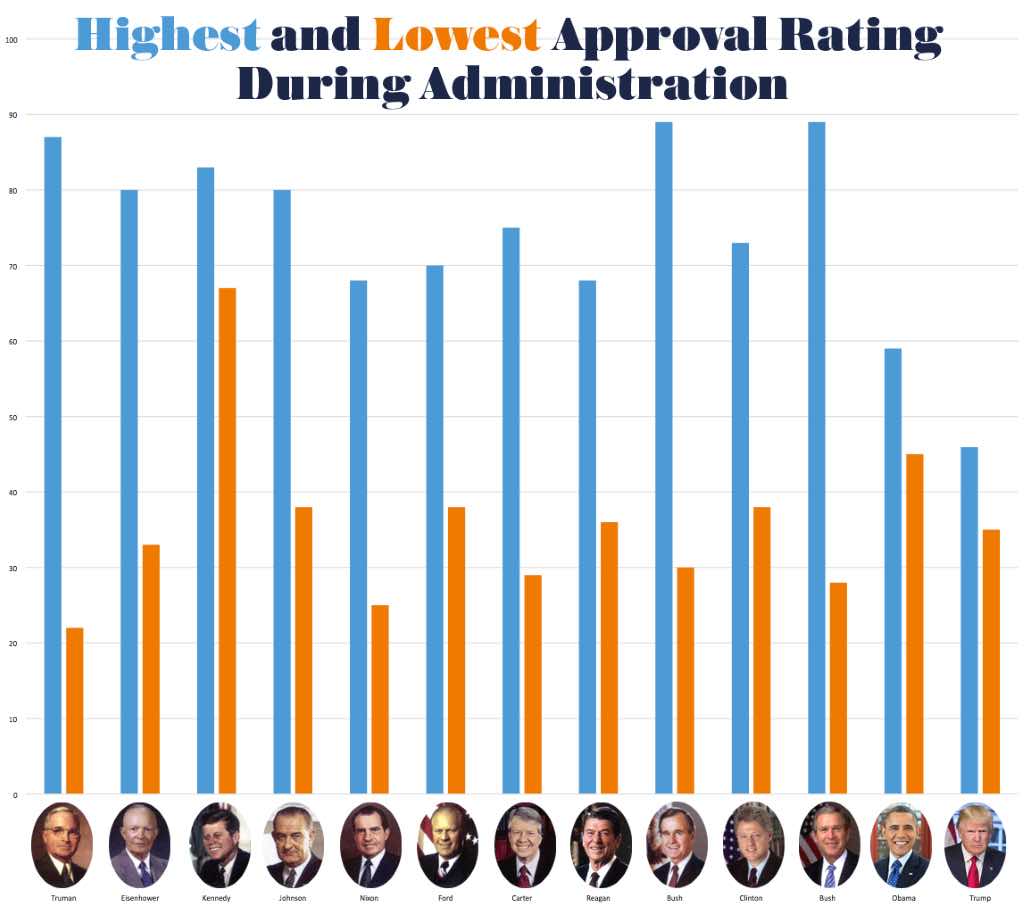
Chart showing the highest and lowest approval ratings for each President.
Click to enlarge. Chart reflects data as of 4/19/17. Gallup started polling approval trends in 1945. Data source: http://www.gallup.com/poll/116677/presidential-approval-ratings-gallup-historical-statistics-trends.aspx, http://www.gallup.com/poll/201617/gallup-daily-trump-job-approval.aspx 


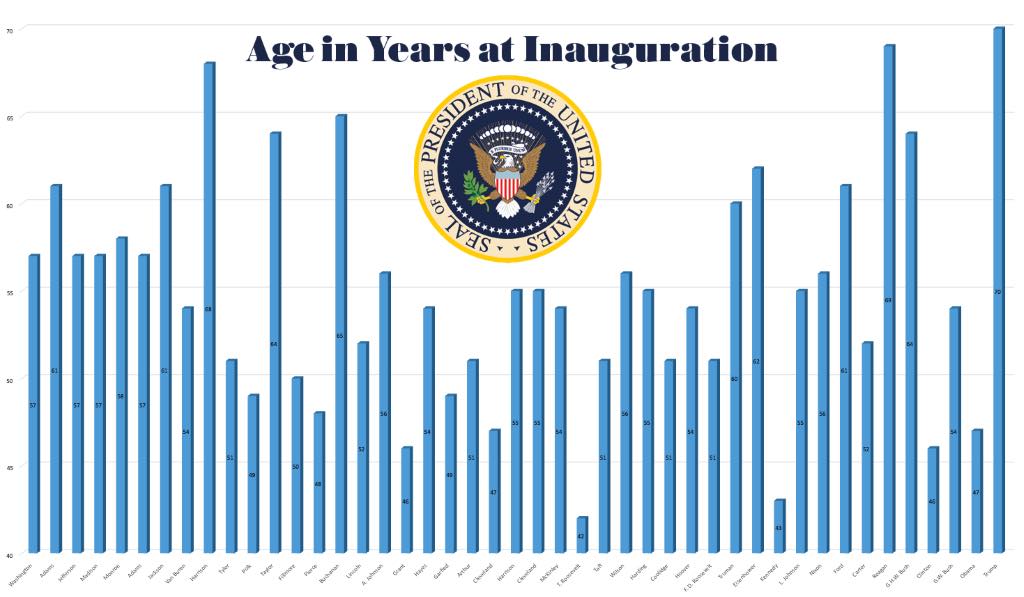
Chart showing how old each U.S. President was at their first inauguration
Click to enlarge. Data source: http://www.robinsonlibrary.com/america/unitedstates/presidents/byage.htm


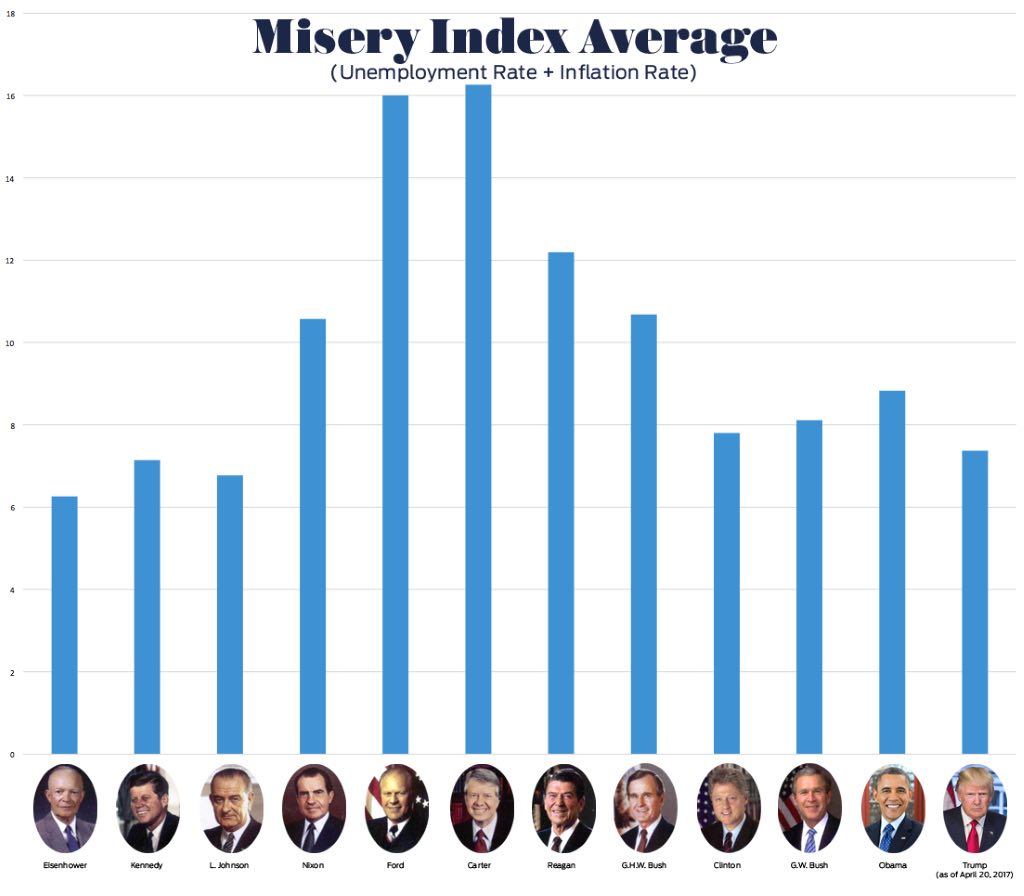
Chart showing the misery index average during presidents' terms in office
Click to enlarge. Data source: http://www.miseryindex.us/indexbyPresident.aspx (chart reflects data as of 4/20/17)


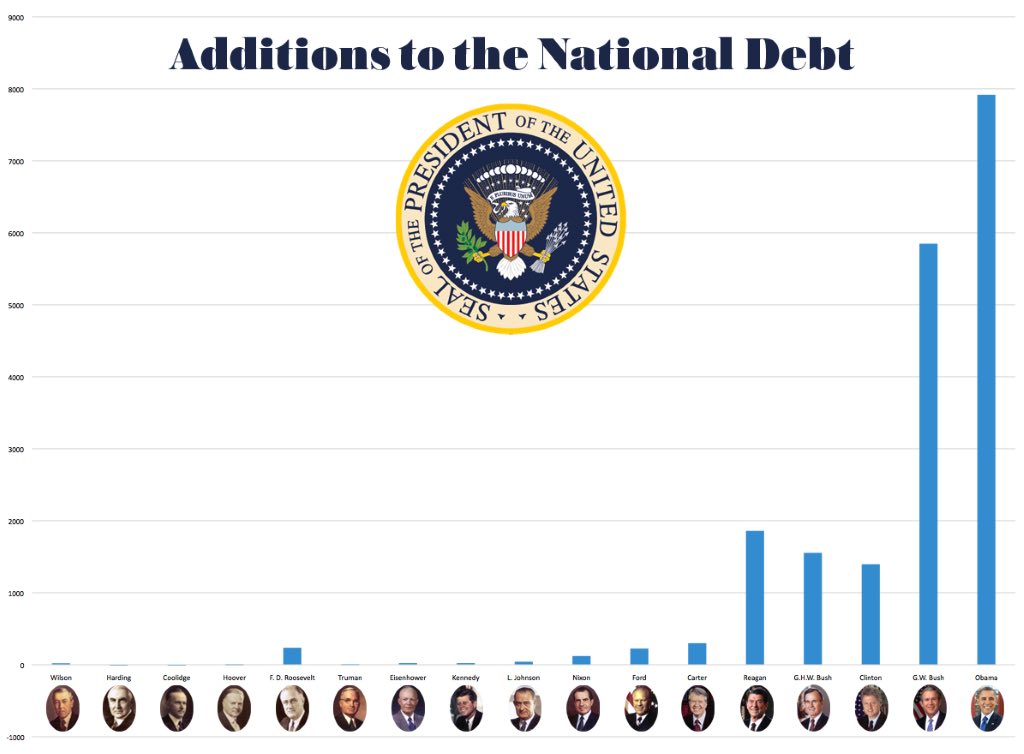
Chart showing how much each president added to the national debt
Click to enlarge. Data source: https://www.thebalance.com/us-debt-by-president-by-dollar-and-percent-3306296 (expressed as nominal dollars, not adjusted for inflation)